

By Jon Harvey | March 5, 2026 | 8 minute read | Chicago, IL
TABLE OF CONTENTS
Are home prices going down in 2026? It’s the most Googled real estate question of the year — and the answer is almost certainly not what you’ve seen in the headlines. Nationally, home prices are not in freefall. But in specific markets, meaningful softening is real, buyer leverage is back, and the conditions for a smart purchase have genuinely improved. Here’s how to cut through the noise and understand exactly what’s happening in your specific market.



The National Picture: Stability, Not a Crash
According to the S&P CoreLogic Case-Shiller Index, national home prices in early 2026 are up approximately 2.1% year-over-year — a significant deceleration from the 15–20% gains of 2021, but still positive. We are not in a national price correction. We are in a normalization.
What’s keeping prices elevated despite mortgage rates near 6.5%? Two structural forces: the lock-in effect (roughly 60% of homeowners hold mortgages below 4% and won’t sell), and continued demand from Millennials and Gen Z entering peak homebuying years. Neither of these forces disappears in 2026.
The national median home price is a statistical abstraction. It tells you almost nothing about what’s happening in your zip code. I tell every client: always start local.
Jon Harvey, The Realest Estate Blog — Chicago, IL
Markets Where Prices Are Actually Cooling
There are genuine pockets of softening — and if you’re a buyer in one of these markets, this is your window. The cooling is most pronounced where pandemic-era appreciation was most extreme.
Sun Belt Markets That Overheated
Austin, TX has seen YoY price declines of 3–6% in several zip codes as tech sector contraction reduced in-migration. Boise, ID has corrected roughly 8–12% from its 2022 peak. Phoenix outer exurbs — where new construction flooded supply — are down 4–7%.
Coastal Tech Hubs
San Francisco condo prices are down 10–15% from peak in many neighborhoods, while single-family homes in top school districts have held far better. Seattle mirrors this segmentation. These markets reward buyers who are specific about neighborhood and property type rather than making broad market bets.

Markets Where Prices Are Holding Strong
Chicago is one of them. Strong employment fundamentals, a diverse economy, and chronic undersupply in desirable neighborhoods have kept the Chicagoland market resilient while coastal markets softened. The same pattern holds in Columbus, Indianapolis, and Hartford — cities with real economic demand and not enough homes to meet it.
| Market | YoY Price Change | Months of Supply | Trend |
|---|---|---|---|
| Chicago Metro, IL | +4.8% | 1.6 months | 📈 Resilient, tight inventory |
| Columbus, OH | +5.8% | 1.4 months | 📈 Strong seller’s market |
| Hartford, CT | +6.2% | 1.1 months | 📈 Extremely tight inventory |
| Greenville, SC | +4.9% | 1.7 months | 📈 In-migration driving demand |
| Indianapolis, IN | +4.1% | 2.0 months | 📈 Affordable, resilient |
| Austin, TX | -4.2% | 4.8 months | 📉 Buyer leverage returning |
| Boise, ID | -5.1% | 5.3 months | 📉 Notable correction from peak |
How to Read Your Local Market in 30 Minutes
Here’s the exact process I walk clients through — using only free, publicly available data.
Step 1: Check Months of Supply
Search Redfin or Zillow for your target city or zip. Under 3 months = seller’s market. 3–6 months = balanced. Over 6 months = buyer’s market with meaningful leverage. This one number tells the full supply-and-demand story in your market.
Step 2: Track the Sale-to-List Price Ratio
Above 100%: multiple offers, homes selling over ask. 97–100%: modest seller advantage. Below 97%: meaningful buyer leverage, sellers accepting concessions. Redfin publishes this by city and neighborhood, updated monthly.
Step 3: Look at Price Reduction Rate
What percentage of active listings have had at least one reduction? Under 15%: hot market. 25–40%: cooling. A high reduction rate is one of the earliest signals that seller expectations are adjusting — and that list prices will follow in 60–90 days.
Free Tools to Bookmark: Redfin Market Tracker (redfin.com/news/data-center), Zillow Market Reports (zillow.com/research), and the FHFA House Price Index (fhfa.gov). Check monthly — not daily. Real estate moves slowly.
What This Means for Buyers and Sellers Right Now
If You’re Buying in a Cooling Market
This is the best buying environment in several years for markets like Austin, Boise, and parts of the Bay Area. Inspections are back. Sellers are offering rate buydowns and closing cost credits. Days on market have stretched to 45–90 days. The risk is waiting for further drops that may not come — markets don’t bottom cleanly. They bounce along a floor before recovering.
If You’re Buying in Chicago or Another Tight Market
Don’t wait for a buyer’s market that isn’t coming. In 1.4–1.6 month supply environments, preparation beats timing every time. Get pre-approved. Know your ceiling. Move decisively when the right property appears. Hesitation in a tight market costs you the house.
If You’re Selling
Pricing discipline is everything. Buyers in 2026 are data-savvy — they’re pulling comps, tracking reduction rates, and calculating carrying costs at 6.5% rates. Price accurately on day one. A well-priced listing that generates early momentum almost always outperforms an overpriced listing that eventually reduces.

Tools to Help You Track and Prepare
DealCheck — Investment Property Analyzer
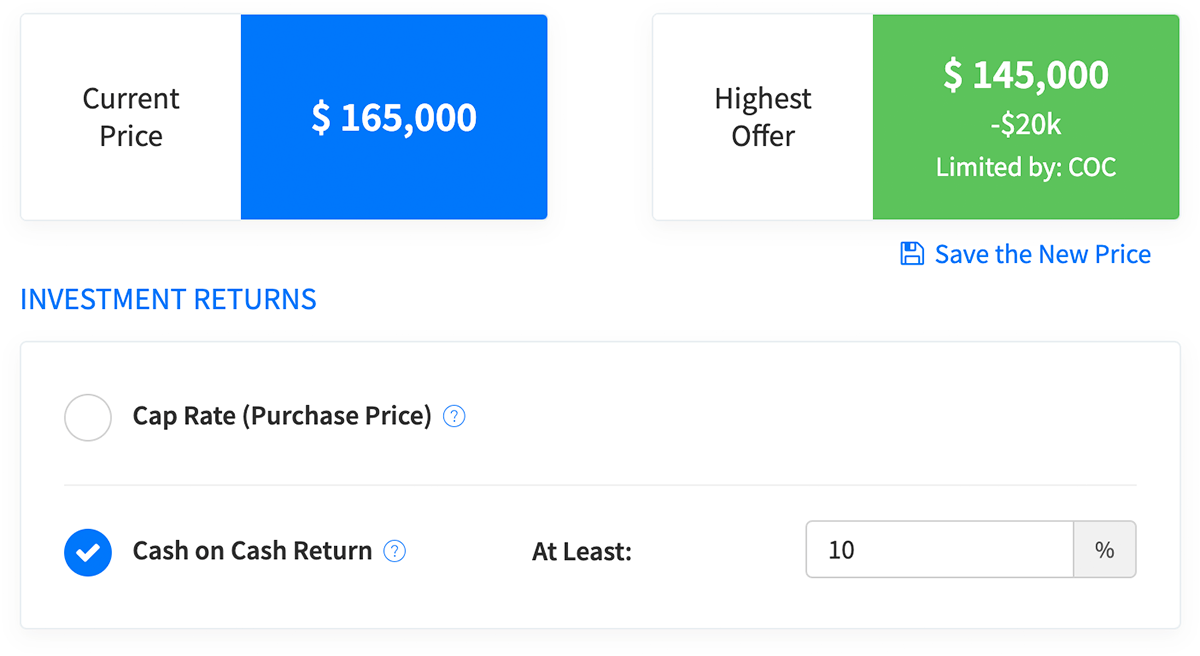
If you’re evaluating a purchase as an investment, DealCheck is the most intuitive deal analysis tool I’ve used. Run cap rate, cash-on-cash return, and DSCR calculations in seconds. Model the same property at different price points and see exactly how the numbers shift as market conditions change.
Mashvisor — Rental Market Data
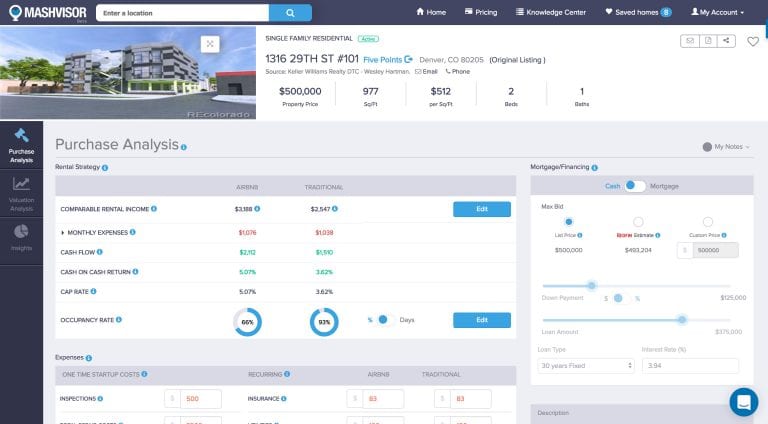
Mashvisor provides neighborhood-level rental income estimates, occupancy rates, and cash-on-cash projections — useful for evaluating whether a property works as both a home and an investment. Use promo code AFF15 for a 7-day free trial plus 15% off any plan.
Monarch Money — Know Your Real Numbers
Monarch Money is the personal finance tracker I recommend to every client before they start shopping. Connect all your accounts, see your real net worth, and model exactly how a home purchase changes your monthly picture. Knowing your numbers removes the anxiety from the process.
The Bottom Line on 2026 Home Prices
Stop reading national headlines. Start pulling local data. Months of supply, sale-to-list ratio, and price reduction rate will tell you everything you need to know about your specific market. In Chicago and most Midwest cities, prices are holding — preparation beats timing. In cooling markets like Austin or Boise, buyer leverage is real — but windows don’t stay open indefinitely.
🏠 Part of the Week 1 series. For the full picture: The Ultimate 2026 Guide to Navigating the Real Estate Market
Continue the Series
- Demystifying the Down Payment: Why You Don’t Need 20%
- The Hidden Costs of Buying a Home Explained
- Buyer’s Market vs. Seller’s Market: How to Negotiate Today
Want to reduce carrying costs from day one? My guide on 5 Ways to Retrofit Your Home to Save Energy covers the upgrades that matter. And if smart home features are on your radar, the Ultimate Luxury Smart Home Guide 2026 is worth a read.
 TheRealestEstate