
The Infamous Data Center
For nearly a century, the valuation of Commercial Real Estate (CRE) relied on a standard set of physical variables: traffic count, highway accessibility, rail spurs, and proximity to ports. In the residential sector, value was dictated by school districts and aesthetic trends like the economics of quiet luxury. These physical attributes were the “gold standard” for determining capitalization rates and long-term appreciation.
However, as we settle firmly into 2026, a new, largely invisible infrastructure is rewriting the rules of real estate economics. We are witnessing the largest infrastructure build-out since the Interstate Highway System of the 1950s, but this time, it isn’t asphalt being laid—it is fiber optics and high-voltage power lines connecting massive data centers. The proximity to these digital hubs has become the single most significant predictor of future asset value in specific sub-markets.
The explosion of Generative AI, the maturation of smart home technology, and the ubiquity of autonomous logistics have turned data centers into the heartbeat of the modern economy. For astute investors, this presents a unique, generational opportunity. Properties located within the “Halo Zone” of major data hubs—places like Northern Virginia (NoVA), Phoenix, and emerging markets in the Midwest—are seeing appreciation rates and lease premiums that completely defy broader market trends.


The Physics of Value: Understanding the “Latency Premium”
To understand why a warehouse or a flex-office building is worth significantly more simply because it sits two miles from a hyperscale data center, we have to look at the physics of the internet. Despite the cloud feeling “instant,” data is still bound by the speed of light. Every mile of fiber optic cable adds microseconds of delay, or “latency,” to the transmission of data.
In 2026, microseconds translate to millions of dollars. High-Frequency Trading (HFT) firms, AI inference engines, autonomous vehicle command centers, and telemedicine providers require near-zero latency. They cannot afford the lag of routing data across the country. Consequently, businesses in these sectors are engaging in a bidding war for commercial space that physically sits on the same fiber backbone as the data centers hosting their core compute loads.
This has given rise to the “Latency Premium.” If you own commercial property in these specific zones, you aren’t just renting square footage; you are renting connectivity. We are seeing industrial rents in data-dense corridors trading at a 20% to 30% premium over comparable properties just ten miles away.

Analyzing the “Power Shell” Asset Class
Beyond latency, the second critical factor driving this trend is power. Artificial Intelligence models consume an astronomical amount of electricity. In many primary markets, the electrical grid is constrained, and waiting times for new high-voltage utility hookups can exceed 36 months.
This scarcity has created a massive opportunity for existing CRE assets that have “heavy power” already on-site. Manufacturing facilities, older industrial parks, and even defunct shopping malls with robust electrical substations are being snapped up not for their structures, but for their power capacity. Investors are repurposing these sites into “Powered Shells”—essentially weather-tight buildings with massive power and cooling capacity ready for a tenant to install their servers.
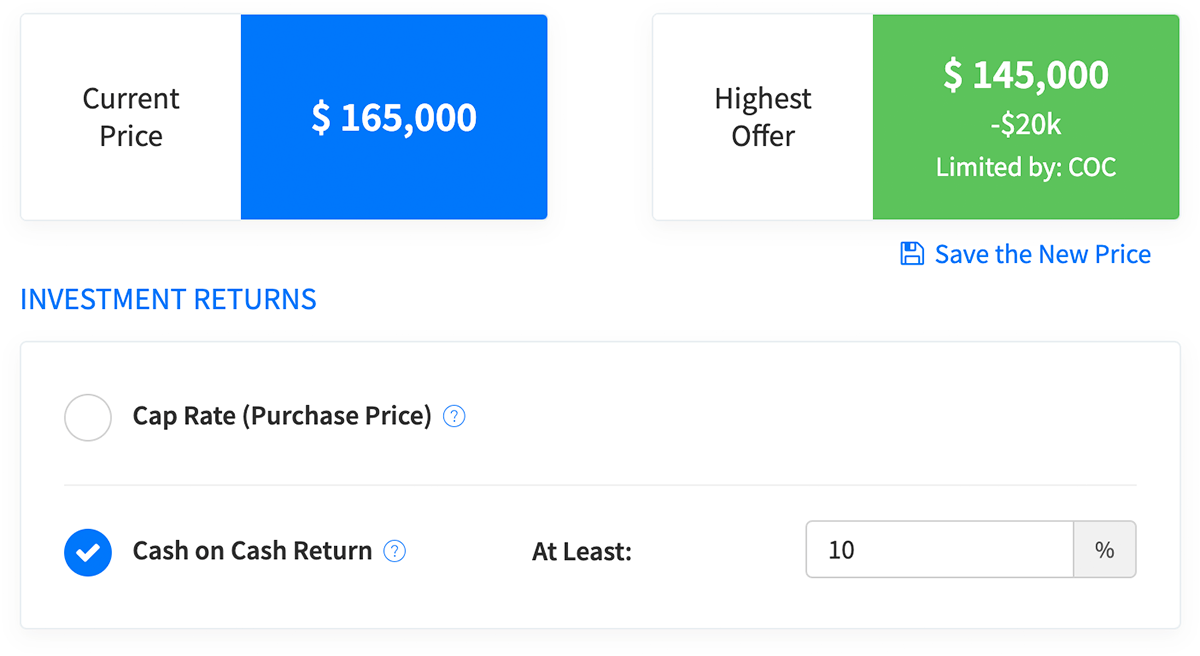
Evaluating these deals requires a shift in how we crunch numbers. You can’t simply look at standard cap rates. You need to evaluate the cost of power upgrades, the zoning density for digital infrastructure, and the lease comparables for high-tech tenants versus standard logistics tenants.
Investment Property Analysis
The Residential “Halo Effect”
The impact of a new hyperscale data center extends far beyond the industrial park. There is a well-documented “Halo Effect” on the surrounding residential real estate market, though it functions differently than a traditional corporate headquarters.
Data centers are capital intensive but not necessarily labor-intensive regarding daily operations. However, the construction and maintenance phases are massive economic engines. Building a single campus can take 3-5 years and requires thousands of specialized electricians, HVAC technicians, and network engineers. Once operational, the facility requires highly paid security teams and rotating shifts of server engineers.


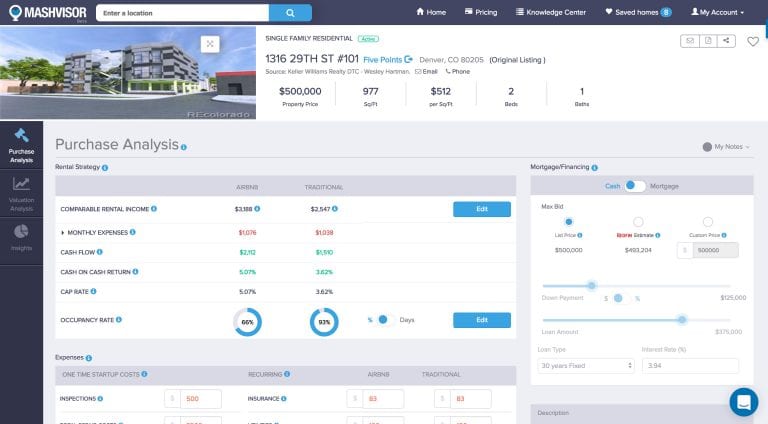
This demographic creates a specific type of housing demand. We are seeing a surge in demand for Short-Term Rentals (STRs) and mid-term corporate housing in sub-markets adjacent to these facilities. These workers often travel on multi-month contracts and prefer furnished homes over hotels. For investors familiar with scaling a rental portfolio, this is a prime pivot point.
Investors are successfully buying duplexes and townhomes in these “unsexy” industrial-adjacent neighborhoods and converting them into high-yield corporate rentals. The key is identifying the specific zip codes that service the facility’s workforce without being so close that you deal with the hum of the cooling towers.
If you are targeting this tenant base, standard amenities aren’t enough. The number one amenity for tech workers is connectivity. A property with direct fiber-to-the-home (FTTH) and hardwired ethernet in the home office will lease 50% faster than a comparable unit with standard cable internet.
Identifying these micro-markets requires granular data. You cannot rely on city-wide averages because the demand is hyper-localized to the commute radius of the data center campus.
Rental Market Intelligence
Reader Deal: Use code AFF15 for a 7-day free trial + 15% off forever.
The Future Landscape: Edge Computing and Decentralization
As we look toward the latter half of the decade, the centralization of the internet is beginning to fragment. We are moving toward “Edge Computing,” where data processing needs to occur closer to the end-user to support things like augmented reality and real-time AI translation.
This means the investment opportunity is no longer limited to the “Big Three” markets of Northern Virginia, Silicon Valley, and Dallas. We are seeing massive growth in Tier 2 and Tier 3 cities like Columbus, Ohio; Salt Lake City, Utah; and Des Moines, Iowa. These markets offer cheaper land, cooler climates (reducing cooling costs), and more available power capacity.
For the smaller commercial investor, this is the entry point. You don’t need to compete with BlackRock for a $500 million campus. You can look for the support infrastructure in these emerging cities: the warehouse that can store server racks, the office space for the engineering firms, or the land that sits on the path of the new fiber rings.
Actionable Steps for the Forward-Thinking Investor
The real estate game hasn’t changed, but the scoreboard has. It’s no longer just about foot traffic; it’s about network traffic. By positioning your portfolio near the physical infrastructure of the internet, you are future-proofing your investments for the digital age.
Start by mapping the grid. Look at local utility filings to see where heavy power upgrades are being approved—data centers always follow the power. Once you identify the location, look at the zoning maps for adjacent properties. Is there a B-class industrial park nearby that could be repositioned? Is there a residential neighborhood that is about to see an influx of high-income contractors?
The intersection of technology and dirt is where the highest ROI will be found in 2026. It requires new metrics and new tools, but the fundamentals remain the same: supply, demand, and location.


[…] while saving money and helping the environment. Understanding the world of Smart Home Tech and Real Estate Investing can help you stay ahead of the […]
LikeLike